App marketers and ASO experts are always looking for ways to improve the performance of their mobile apps. To improve app store optimization and paid user acquisition results, you need to use the tools that provide valuable insights and data analytics. If your focus is on the Android apps in the Play Store, you need to use Google Play Console regularly.
Google Play Console or Google Play Developer Console is the management and reporting platform for Android apps listed in Google Play Store. The Console provides the data directly from Google, which means it is the most reliable and trustworthy Android app data you can get.
There are two primary target users of the Google Play Console.
App developers who are focused on the development, publishing, and monitoring of the technical performance of their apps
App marketers who are looking to work on Google Play Store optimization, improve conversion rates, and monitor the store performance of their apps
Google Play Console is one of the most important tools with comprehensive and first-party data that should be used and analyzed every week. In this article, we will focus on the value that the Console has for app marketers and app store optimization (ASO) experts. The optimizations you are doing around your app will impact your organic rankings in the Play Store. Still, they can also influence the paid user acquisition if you run Google app campaigns.
We assume that you already have your app listed and running, so this guide is for those who want to actively work on the analysis and optimization of their app.
There are six main areas you can find once you login into the Google Play Console:
Main dashboard with high-level statistics and general information
Release management
Grow section
Quality section
Monetize menu
Policy and guidelines
Once you read the article, you will be able to feel more confident about the interface and will know how to use the tabs to improve and grow your app.
Let’s dive in!
Main dashboard, statistics, and general information in Google Play Console
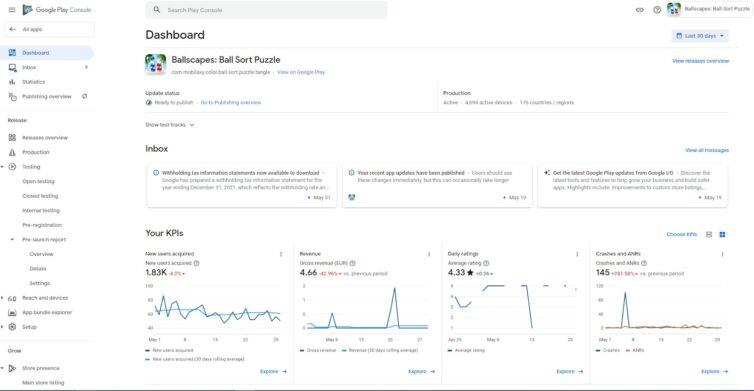
When you log in to your Google Play Console account and select your app, you will see the main dashboard with inbox messages, an overview of the statistics, and the left sidebar with other options. Throughout the article, we will use the app “Ballscapes: Ball Sort Puzzle” to show you all the menus inside the platform.
The overview dashboard in Google Play Console.
The main dashboard serves as an overview of your app’s performance, health, and technical stability. Some of the things that you can see in the dashboard include:
KPIs that you select, e.g., new users acquired, revenue, lost users, app crashes, and daily ratings
Store listing performance – traffic sources, conversion rates, top countries
Android vitals data
Ratings and reviews overview
Pre-launch services
App size
Other elements that are relevant to your app
After having a quick look, the best thing to do is to click on the “Statistics” tab in the left sidebar and check the data you have inside.
Statistics
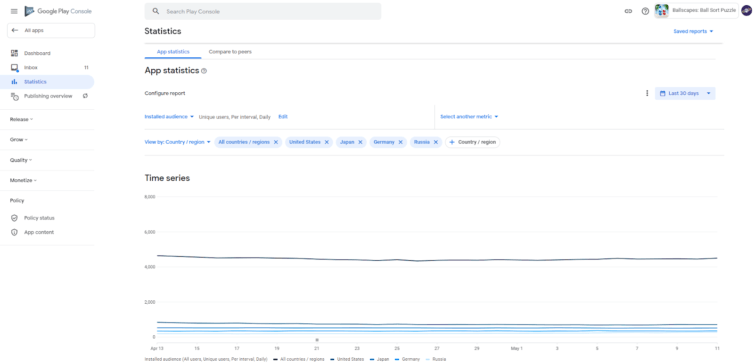
The Statistics tab offers a deeper look into the app’s performance by using different data points and filters. You can export the report within the screen, display up to two data points, and compare the performance with the past period.
The Statistics tab in Google Play Console.
You can use the following categories/filters for the graphical display:
Users – installed audience, user acquisition, and user loss
Devices – install base, device acquisition, device loss, device updates, device loss after the update, install events and uninstall events.
Engagement – daily active users (DAU), monthly active users (MAU), and monthly returning users
Ratings – average rating and Google Play rating
Quality – crashes, ANRs, app download size, app size on the device
Monetization – daily and monthly buyers, purchases per day and month, gross daily and monthly revenue
Pre-registration – pre-registered users and conversions
Store listing performance – acquisitions and visitors
If you select “Users,” “Devices,” or “Store listing performance” categories, you can also segment the data for “all, new and returning users.”
Once you select the categories you are interested in, you can also add additional segmentation layers that include views by:
Country or region
Android version
Device
Device type
Language
App version
Carrier
Expert tip: Don’t get overwhelmed with the reporting and presentation possibilities. Focus on the areas that matter to you and your goals. It is not the same if you are a developer or app marketer.
The “Statistics” tab also shows something that we highly recommend checking, which is comparing your app with your peers or similar apps. Here, you have fewer categories that you can plot graphically, but you can compare your app with those from different Play Store categories.
The Statistics tab in Google Play Console.
Inside the peer group, you can use the following categories for the comparison:
Store listing acquisition rate: all users, new users, and returning users
Audience: growth rate or user loss change
Engagement: DAU/MAU, returning users, DAU growth rate, MAU growth rate
Monetization: revenue per user, purchases per user, buyer ratios, and revenue per purchase
App marketers can use peer comparisons for primary groups (e.g., Action games) and secondary groups (e.g., Action-adventure) with each peer group’s median, 25th, and 75th percentile data points. Even though your app might be in a different category, you can still compare your app with any other peer group and choose between 32 groups overall.
Art & design (drawing)
Finance (cryptocurrency, insurance, investment, loan, mobile banking, mobile payment, personal finance)
Travel & local (air travel, houses & vacationrental, public transport, taxi & rideshare, travelguide)
Education (driver’s education, language education, mathematics, science education, study guide, test preparation)
Music & audio (audio recorder, karaoke, lyrics, music instrument, radio, sound effect)
Video players & editors (video editing, video player)
Entertainment (coloring book, humor)
News & magazines (news aggregator)
Weather
Events
Parenting
Primary and secondary peer groups in Google Play Console
Once again, we highly recommend you focus on the elements and KPIs that matter the most to your app and business. With the wealth of data available in the Play Store, it is easy to be distracted from the metrics that matter to your app category.
Now that you know the data you can get in the “Statistics” view, it is time to continue with a quick overview of the “Release” section.
Release management
The “Release” section contains mostly parts related to app developers. There are six subsections in this section:
Releases overview
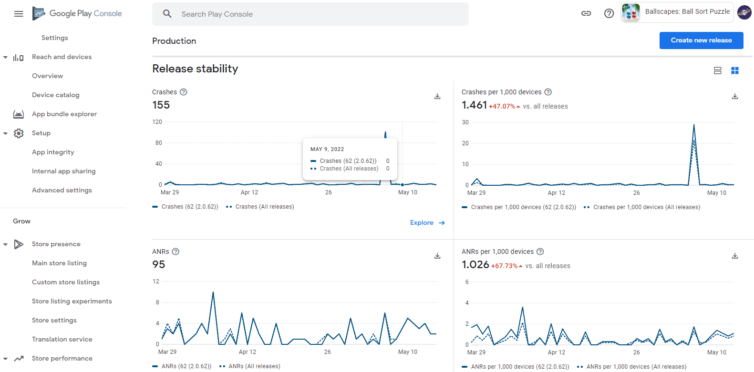
Production tab – shows releases dashboard, releases, countries, and regions where your app is currently available.
Testing tab – shows different testing types (open, internal, and closed testing), pre-registration, and pre-launch reports.
Reach and device overview
App bundle explorer – for managing all app assets in one place
Setup tab for checking app integrity, internal app sharing, and advanced settings
From our experience, we don’t see app marketers and ASO teams using the “Release” section that much. There is some information about the crash rates and exciting insights on your app users’ devices, but this data is nice-to-have and not actionable.
The only part that you might use is the pre-registration subsection. If you haven’t launched your app yet and want to create excitement about it before the official release, the pre-registration campaign in Google Play Console is a good choice for this. Furthermore, if your app is in the pre-registration status, you can use Google app campaigns for pre-registration and generate signups with paid ads.
The Production tab overview in Google Play Console.
Now we will look at the most critical section for app marketers – the “Grow” section.
Grow section in Play Console and ASO importance
The “Grow” section has two main subsections – Store presence and Store performance. If you manage a game app, you will also see the third subsection called Play Game Services, but we won’t focus on this section in this guide.
Let’s explore the first significant option, the “Store presence” tab.
Store presence and Google Play Store optimization
There are five subsections inside the Store presence section:
Main store listing
Custom store listing
Store listing experiments
Store settings
Translation service
New feature: a new option is coming to this section soon, called Google Play LiveOps cards. Soon it is going to be released to all app publishers. The new feature will improve your app’s visibility across the Play Store and increase user engagement.
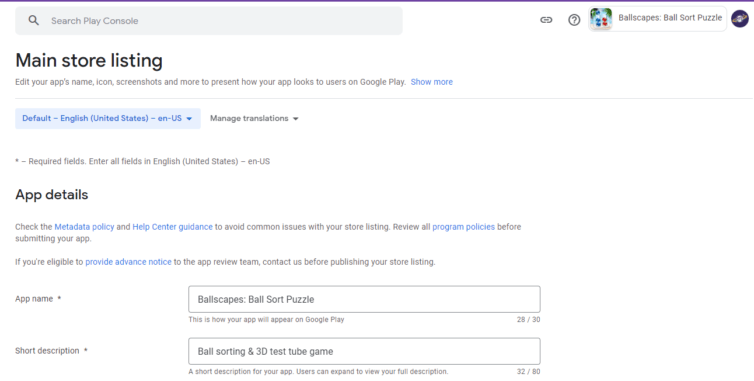
Main Store Listing
The “Main store listing” is probably the most important tab in the Google Play Console if you are an app marketer. Everything that your app’s users see in the Play Store is editable in the Main store listing, from metadata to creative assets.
Specifically, the fields you can edit in the Main store listing include:
App name – maximum 30 characters you can use for it
Short description – maximum of 80 characters
Full description – maximum of 4.000 characters
You can also upload your app store assets here:
App icon
Feature graphic
Video (not mandatory)
Phone screenshots
Tablet screenshots
The Main store listing section and metadata fields.
If you need to change our add metadata to different localizations, you can do it directly with App Radar’s store listing editor. You will save much time and check your ASO performance simultaneously.
Custom store listing
Custom store listings allow you to create a customized page for different countries, including pre-registration campaigns. At the moment, you can have a total of five custom store listings running at the same time.
Google announced at Google’s I/O developer conference in May 2022 that Android app developers will in the future be able to create up to 50 custom store listings. And each page will have dedicated analytics and deep links.
For example, say you have an app that offers shopping discounts for stores in France and Belgium. Each country has stores with different types of discounts, but the problem is that if users in Belgium have the French language set as the primary one on their Android device, they will see the discounts redeemable only in France.
To solve this problem, you can create a custom store listing specifically for a French-speaking audience that lives in Belgium. The custom store listing for the Belgium audience should include metadata and images about the Belgian stores.
The custom store listings contain the same types of fields as regular store listings, which means that you can provide specific markets with the same quality of information.
Store listing experiments
Google Play Console gives you a chance to run A/B tests inside the platform for default graphics experiments or localized experiments (up to five languages). This feature is handy for providing accurate test results, and it comes directly from Google Play Store. You can test attributes, including a short description, full description, app icon, feature graphic, screenshots, and promo video.
Although very useful, the store listings experiments had their limitations – Google Play Console locked the confidence interval at 90%, no manipulation of the audience, no post-install metrics, and without additional insights such as user engagement.
But Google I/O 2022 also brought some updates to store listing experiments. According to the official website of Android developers, the app publishers will be able to “see results more quickly for most experiments, with more transparency and control to help you anticipate how long each experiment is likely to need.”
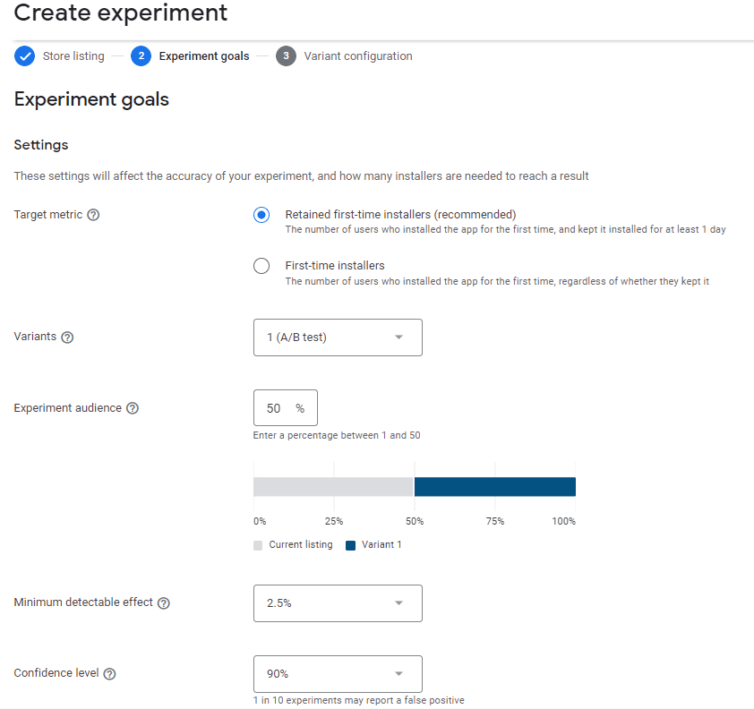
You can decide if you want to focus on
retained-first time installers or first-time installers
the number of variants (A/B, A/B/C, or A/B/C/D test)
Experiment audience percentage
Minimum detectable effect
Confidence level
Experiment goals in Store listing experiments in Google Play.
If you are not using the new or store listing experiments in general, we suggest you start as soon as possible and always test what works the best with your Play Store listing.
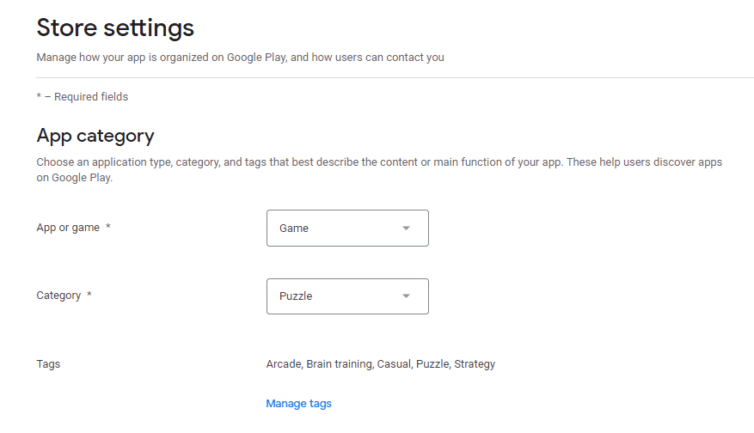
Store settings
Under the “Store settings” tab, you can choose if you are listing an app or game, the category of the app, and the tags (also available inside the App Radar). These elements are essential for your app visibility, so select the right category and tags relevant to your app.
Store settings interface in Google Play Console.
Translation service
Translation service allows you to hire human translations for your store listings, app strings, and in-app products starting at $0.07 per word. If you operate an app present at multiple locations globally, you will want to localize the store listings for different languages. However, the translations often don’t consider the app store optimization specifics and keywords you want to target.
It is better to use an agency specialized in app localizations, such as the App Radar agency, or someone else who has experience with the app business.
Store performance and app analysis
The store performance section consists of two subsections – Store analysis and Conversion analysis. With the help of this section, app marketers and developers can regularly check the data on the store, listing visitors, acquisitions, and conversion rates across different dimensions.
Store analysis
There are many helpful data breakdowns in the Store analysis section:
Store listing acquisitions by traffic source (Google Play search, Google Play explore, and Third-party referrals) and comparison with the previous period you select
Store listing performance, which includes Store listing visitors, store listing acquisitions, and store listing conversion rate
Store listing acquisitions data in separate tables with the breakdown per country, language, search term, app install states, UTM sources and campaigns, and the store listing type the user visited.
The Store analysis tab gives you a high-level overview of the most important categories and their performance, but to dig deeper into each category, you need to check the Conversion analysis.
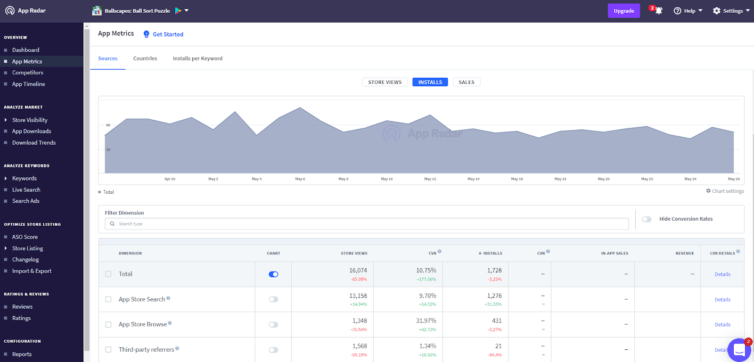
Expert tip: you can track your essential app metrics inside the App Radar platform. When you connect Google Play Console and App Radar account, you view your app’s sources, countries, and installs per keyword with conversion rate data. Instead of navigating through different reports and setting up filters, all this data is available in a couple of clicks.
Google Play Store performance metrics in App Radar.
Conversion analysis
The conversion analysis part allows you to configure your reports to make sense to you. There are overall eight main filters you can use, the same ones you can see under the Store analysis:
App install state
Country / region
Language
Search term
Store listing
Traffic source
UTM campaign
UTM source
The most significant advantage is that you can select the attributes for each category and get a couple of essential breakdowns:
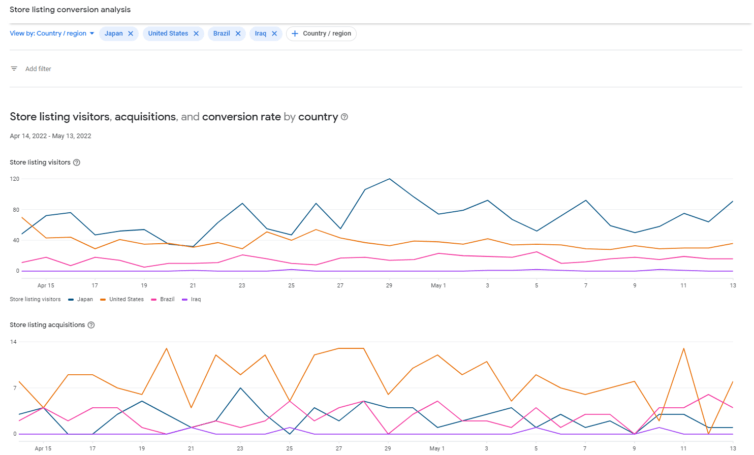
Graphical presentation of store listing visitors, acquisitions, and conversion rates for each primary filter
Table data with an additional column for the comparison of conversion rates between your app and the peers for the last 28 days
Store listing conversion analysis for the selected countries in Google Play Console.
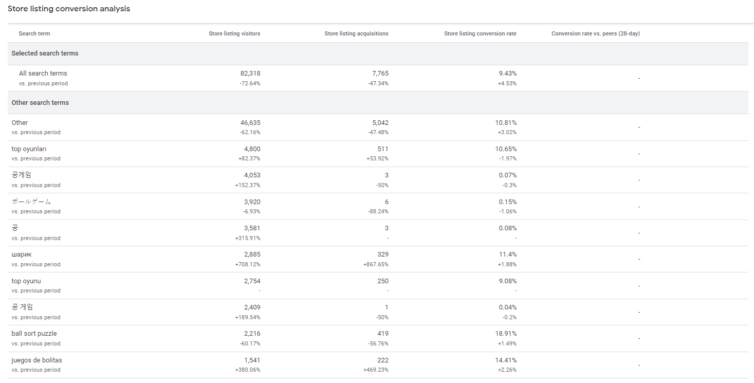
If you are working on your ASO performance and don’t have the budget for a mobile measurement partner (MMP), the “Conversion analysis” report gives you plenty of valuable data:
The change in performance after performing an optimization of the store listing
Most successful countries and conversion rates impact your KPIs
The performance of acquisition sources in Google Play
Keywords that bring you installs
UTM sources and ad campaigns
Google Firebase data
Store listing conversion analysis of the search terms in Google Play Console.
Now that you see the considerable number of options and data breakdowns in the Grow section, it is time to look at another crucial report for app marketers – the Quality section.
Quality
The Quality report consists of two important sections – Rating and reviews and Android vitals.
Ratings and reviews
Google has officially confirmed that app ratings, user reviews, and the number of ratings are considered by the rankings algorithm. What also matters is the velocity of ratings and reviews, which shows why so many companies focus on user review management, among other things.
The Ratings and reviews section consists of four reports – Ratings, Reviews, Review analysis, and Testing feedback.
Ratings
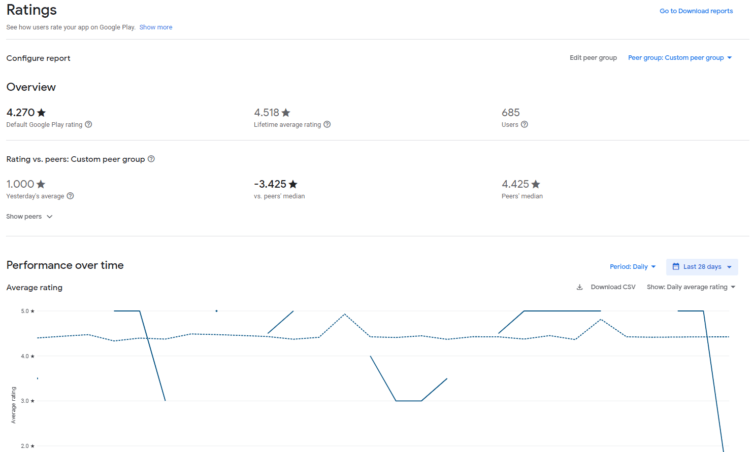
The “Ratings” report gives you a wealth of information on how users rate your app. Inside the report, you can see:
Default Google Play ratings
Lifetime average rating
Number of users that rated the app
Rating vs. peers
Performance over time
Rating distribution
Ratings breakdown by country, language, app version, Android version, device, device type, and carrier
The Ratings report in Google Play Console.
Each table breakdown can be explored deeper if you want to explore the highest and lowest ratings for a specific period, average rating, rating share, and if you want to navigate directly to the Reviews report.
Based on our experience, you can use the “Ratings” report to:
Analyze how the ratings influence your other KPIs
Plan the resources for countries where you want to improve the ratings
Check if specific devices collect low ratings and then improve the app’s performance
Work on the ideas and tactics to improve the ratings, in case you are receiving bad ratings all the time
Reviews
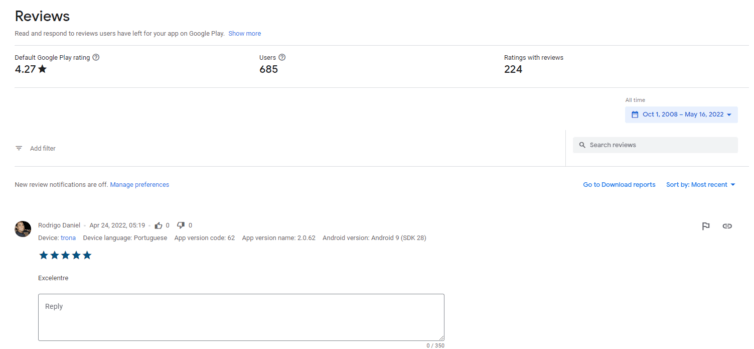
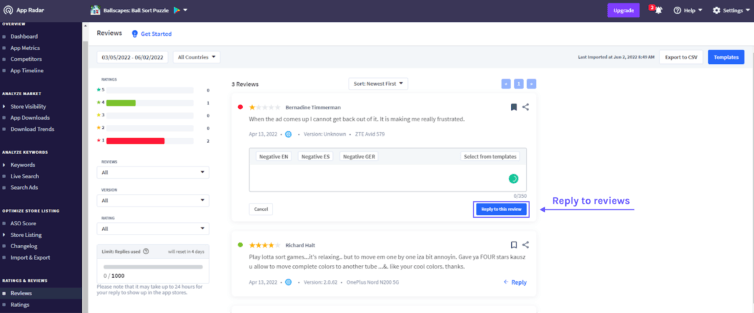
The Reviews report is where you can see all the reviews that your app users leave and directly reply to reviews.
The Reviews report in Google Play Console.
Google Play Console gives you different filtering options in this report as well:
Topic (Google segments the topics based on keywords)
The best way to improve the reviews is to address them on time and show your users that their comments are appreciated. Especially if your app is young and doesn’t have many reviews, you want to ensure that store listing visitors don’t see bad reviews when landing on your app page.
Expert tip: If one of your daily tasks includes replying to user reviews, you can do it in App Radar. To make this process faster, you can create your reply templates and give feedback to users quickly and easily.
Reply to user reviews directly in App Radar using pre-set templates.
Review analysis
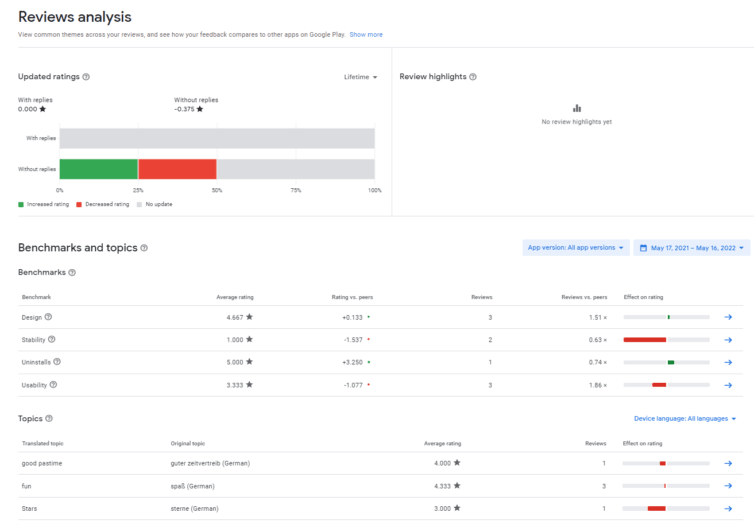
The review analysis report provides additional information on the words and topics your app users leave inside the reviews. There are three main insights from these reports:
The impact reviews have on ratings that were and were not replied to by your team.
The most common user feedback – can be found under Topics with an estimated positive or negative impact on your app’s star rating.
Insights into each rating functional area (such as app design or updates) in the Benchmark report. Furthermore, you can see the comparison for each functional area of your app’s performance vs. your app’s category peers.
Review analysis reports in Google Play Console – Updated ratings, Benchmark and Topics.
Armed with this information, you can actively work on improving your app’s critical elements:
If you notice there is a bug that has an impact on the reviews, you can prioritize it with your developer team.
If people like some of your features, you can use that information to emphasize those features in your marketing communications
If your users often write specific keywords, you can use those for metadata optimization.
Testing feedback
The last part of the Ratings and reviews section is the Testing feedback, where you can see the reviews that your internal testers left. If you work with internal testers and rely on the information they provide, you will find this section very useful.
From the developers’ perspective, Android vitals identify problems on time before users start leaving bad reviews. In short, Google Play’s algorithm takes Android vitals into account and can penalize the apps by lowering their exposure in the Play Store. The app penalization is especially true during the app updates and why ASO teams should constantly monitor android vitals.
Because Android vitals show technical aspects that most developers work with, we will list the essential elements that you can find in the report in this section.
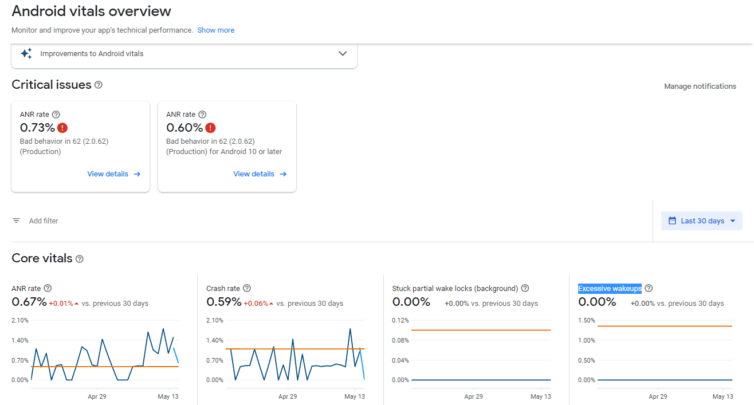
Overview of Android vitals
When you visit the Overview tab in the Android vitals section, you will see much technical information mainly useful for app developers. However, as an app marketer, you need to make sure that the potential issues of your app are recognized and prioritized on time. For instance, high crash and ANR rates can be one of the reasons why you lose app visibility and see a drop in installs.
The first thing that the Overview tab will show you are “Critical issues.” These issues consider the ANR rate, which stands for “app not responding.”
Furthermore, you can see Core vitals metrics, which are performance metrics that can affect your app’s visibility and rank on Google Play. The metrics that belong to Core vitals consist of ANR rate, crash rate, Stuck partial wake locks (background), and Excessive wakeups.
Besides that, the Overview tab shows All vitals metrics that fit into one of the following groups:
Stability
Start-up and loading times
Rendering
Battery
Permissions
Android vitals overview report in Google Play Console.
Expert tip: Always aim at having your crash rate under the bad threshold behavior.
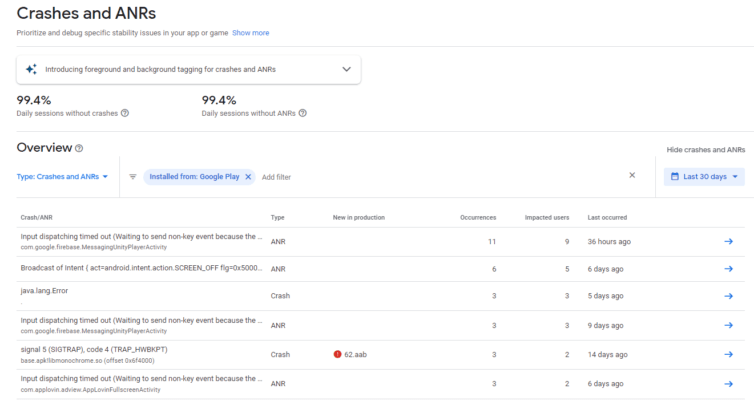
Crashes and ANRs
The section with Crashes and ANRs gives you more detail on the types of issues, how many times they occurred and how many users were impacted. Also, you filter the results based on the Android version, app version, device model, and issue visibility.
Crashes and ANRs report in Google Play Console.
Again, all this information might not mean a lot to you, but you have to make sure that the developers work on improving the stability of your app.
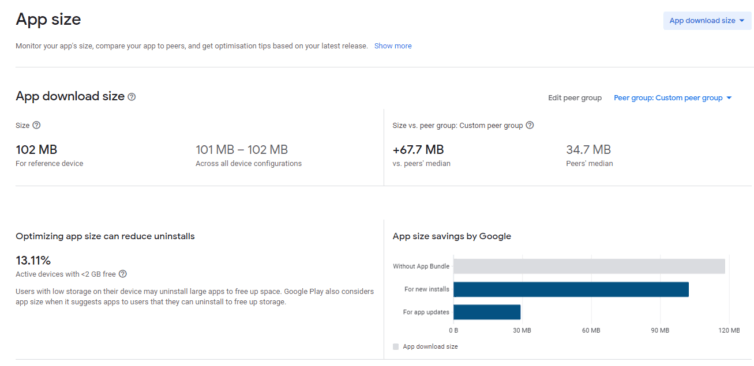
App size
App size report shows you the information on how big your app is compared to your peers and provides suggestions for improving the size of your app. The users generally prefer apps that take less storage space during the first install and the update.
The app size report is also something that most app developers use. Still, it can also be helpful to app marketers, especially if your app has an unreasonable size compared to other apps in the market, which might turn away users from installing it.
App size report in Google Play Console.
The last report you can access under the Android vitals is the performance report. The performance report shows another group of technical details, such as frame rates and loading times.
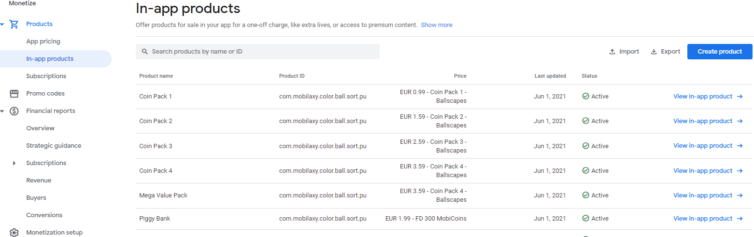
Monetize
The monetize section is where you can dig deeper into all things that have to do with the financial aspects of your app. Although you are interested in these aspects as an app marketer, we often see in practice that ASO teams are not heavily involved in-app monetization. Nevertheless, here is a quick overview of the essential elements.
There are three main reports under the Monetization report – Products, Promo codes, and Financial reports.
The Monetization section and In-app products tab in Google Play Console.
The Products tab consists of three subtabs:
App pricing – this is where you would set your price if your app is not in the “Free” category in Google Play Store.
In-app products – you can create a product for sale in your app for a certain amount of money, such as premium content, extra benefits, and other in-app purchases.
Subscriptions – this option is available if you sell content or services on a recurring or prepaid basis. An example would be a news app with gated content that you have to pay monthly to access.
The promo codes tab is pretty straightforward – if your app supports in-app purchases, you can give your customers promo codes to motivate them to use one of your offers. Inside the Promo codes tab, you can manage everything around the promotion.
The Financial reports tab lets you get a financial perspective of your business model and check how successful you are in your monetization strategy. Here you can see:
Total revenue, revenue per user, and the number of buyers
Strategic guidance where you try to understand the relationship between your in-app product monetization metrics and identify new opportunities
Subscriptions and everything related to retention and cancellations
Deep dive into the revenue and buyers
Conversion rates of your buyers by cohort
If your app is mainly monetized through in-app purchases, products, or services, the monetization reports should be a part of your weekly reporting routine. Many app marketers will integrate Google Play Console with other external tools to monitor monetization success, but checking the data directly from Google is always a good thing.
Policy
The last part of the Google Play Console includes managing compliance with Google Play Developer Program Policies.
Before releasing your app, you need to provide Google with the information on the content of your app:
Covid 19 contact tracing app – if you are eligible for this
Data safety where you need to share what your app’s privacy and security practices are
Privacy policy submission
If your app contains ads
App access instructions – if you use login and authentication forms
A content rating that you receive from official rating authorities
Who is your target audience
If you have a news app
Providing all this information on time will allow you to launch your app without limitations.
Best practices in Google Play Console
Google Play Console gives app marketers a wealth of information and data you can’t find anywhere else. Especially for ASO practitioners, you will find detailed reports, data breakdowns, and everything you need to manage your app efficiently inside the Console optimization areas.
We strongly recommend you always keep an eye on the data in the Grow section and make sure that your metadata and creative assets are optimized and localized. Use the Conversion analysis section to analyze the metrics that matter the most to you.
There is one thing that many people in the ASO community don’t like about Google Play Console. Because it has so many different sections and filtering possibilities, it can be pretty time-consuming when navigating through all the reports. And if you have multiple store listings and different strategies for different locations, you can get lost very easily.
The best way to run your ASO campaigns systematically is to complete the entire workflow quickly and effectively. With App Radar, you do competitor analysis, find and track keywords, and implement them directly in your store listing. After that, you can use Google Play Console data to do ASO analysis in App Radar and continue optimizing your app.
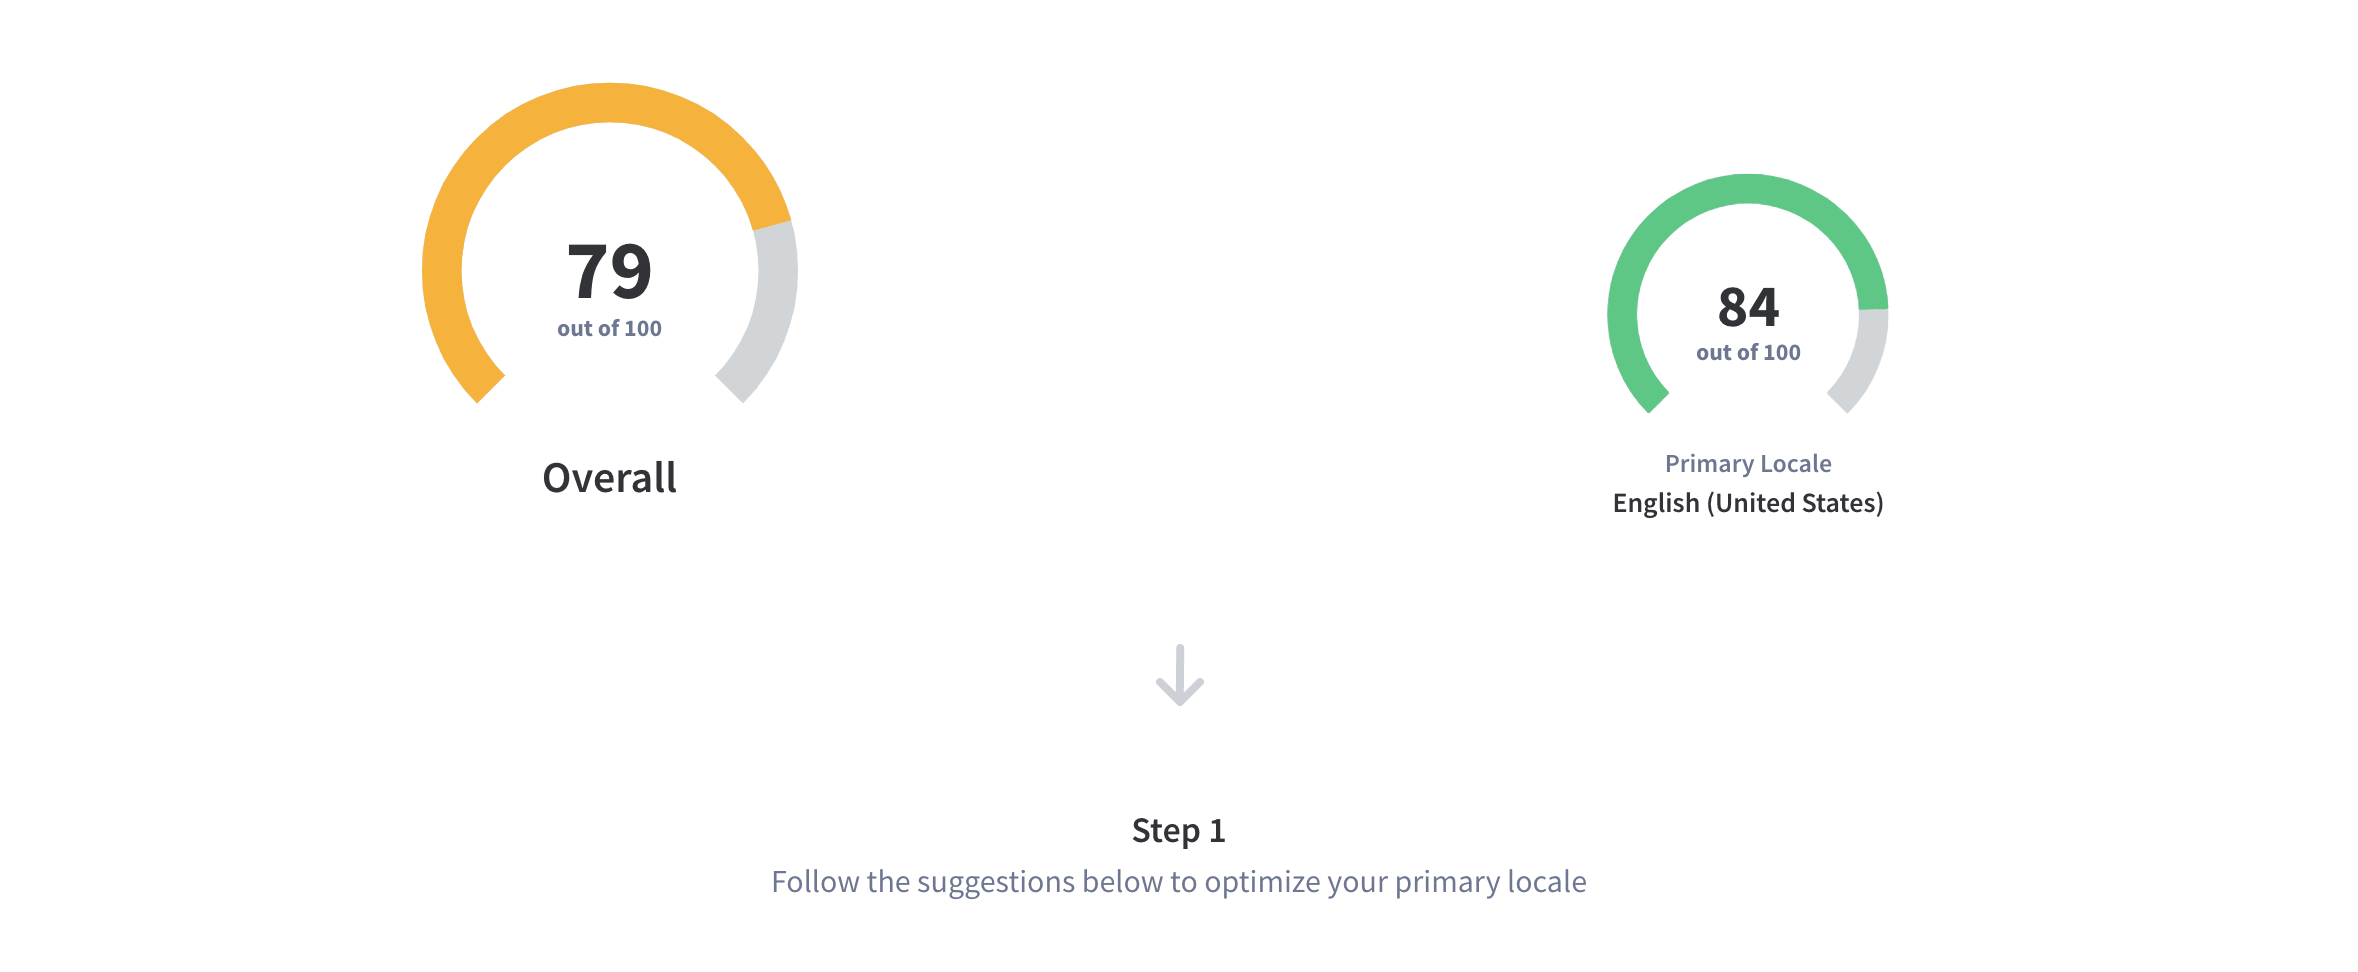
Improve Your ASO Score for Google Play Store
Try out the App Radar platform for 14 days and improve your ASO performance.